I spent a few hours this week correcting the climb test data to standard temperature and 1800 lb gross weight. I used the Density Altitude method, as described in FAA Advisory Circular 23–8C, Flight Test Guide for Certification of Part 23 Airplanes.
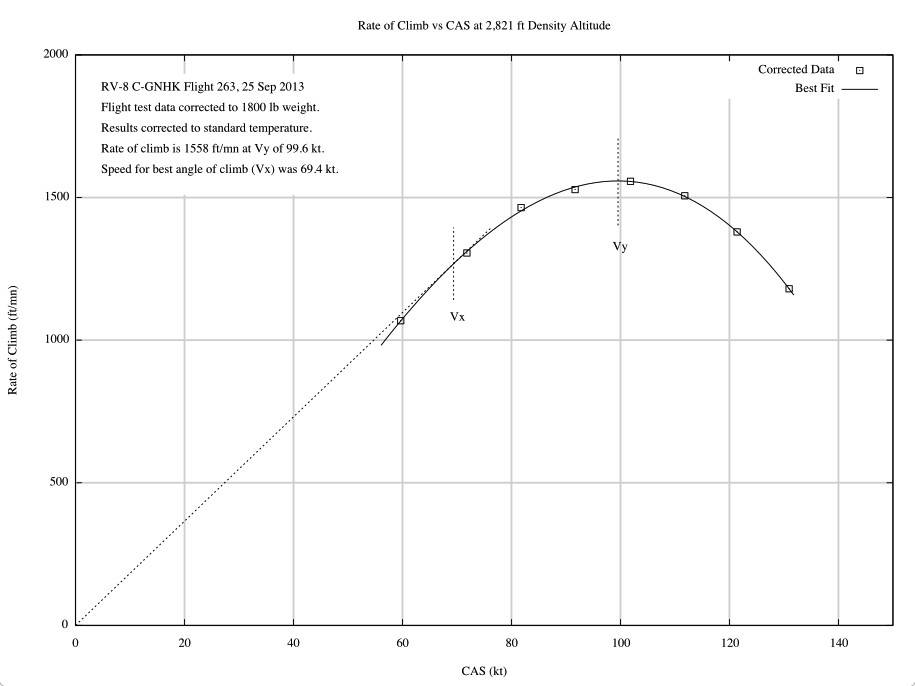 Data from the 2500 ft pressure altitude point, corrected to 2821 ft density altitude. The temperature on 25 Sept was warmer than standard, so the density altitude was higher than the test pressure altitude.
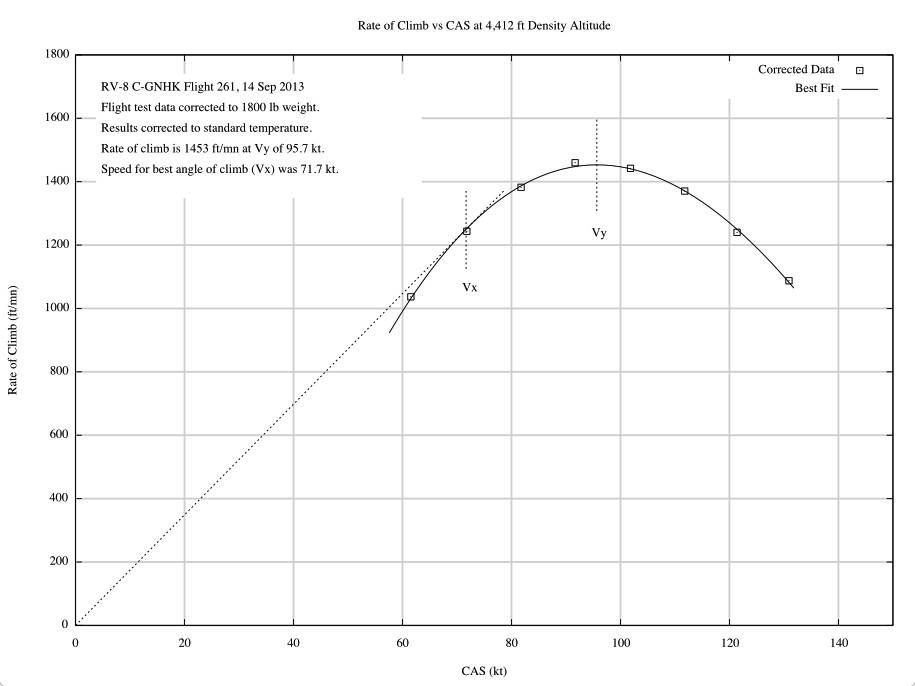 Data from the 4500 ft pressure altitude point, corrected to 4412 ft density altitude. The temperature on 14 Sept was colder than standard, so the density altitude was lower than the test pressure altitude.
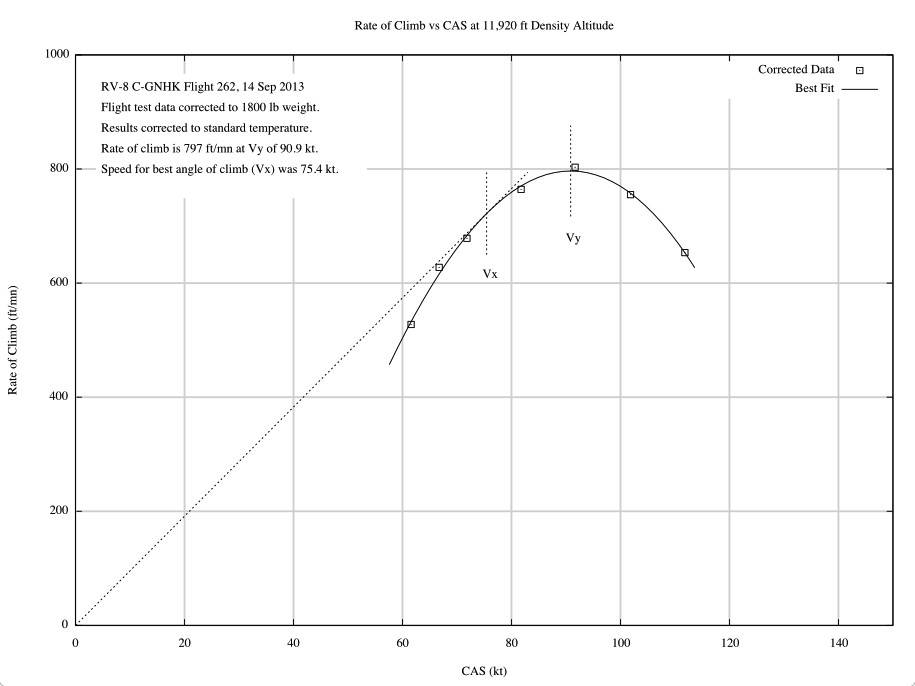 Data from the 11,000 ft pressure altitude point, corrected to 11,920 ft density altitude.
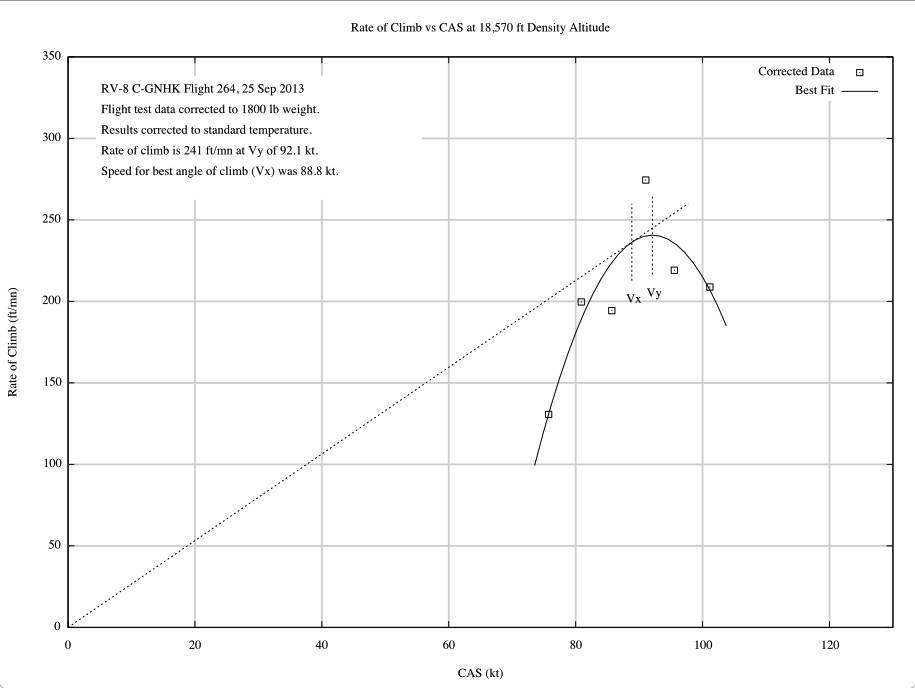 Data from the 17,000 ft pressure altitude point, corrected to 18,570 ft density altitude. I was happy to see that the corrected data for the tests at 17,000 ft makes a bit better, if still ugly, curve than the original raw data.
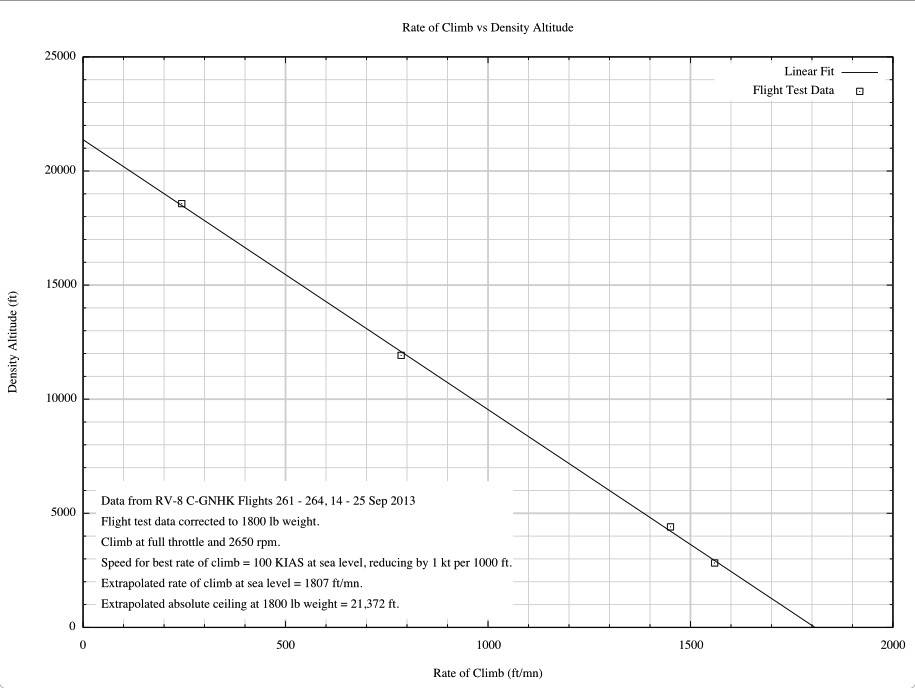 The four test points fall fairly close to a straight line. If I project that straight line to sea level, I get a rate of climb of 1807 ft/mn.
Note that the prop governor is giving 2650 rpm once the oil warms up. I looked at adjusting it to give 2700 rpm, but the actuating arm is hitting the stop. I would need to move the arm on its splined shaft, and the access back there is poor enough that I decided to leave things alone. The engine would make about 4 more hp at sea level if it was running at 2700 rpm, and that extra power would give about an extra 53 ft/mn rate of climb, giving 1860 ft/mn. Vans Aircraft claims 1900 ft/mn, and all their rate of climb specs are rounded off to the nearest 100 ft/mn, so my results are consistent with their performance claims.