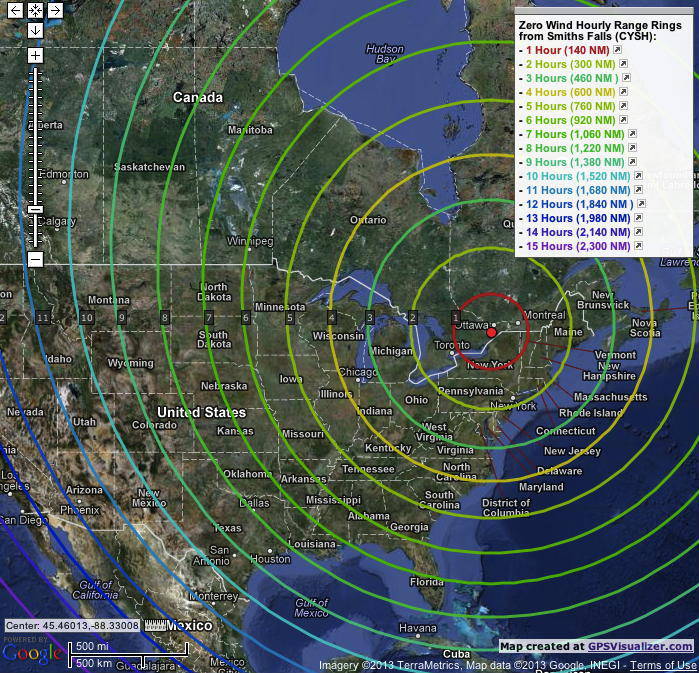
I stumbled across a GPS Visualizer tool that allows you to do things like create images with range rings. I created a page with range rings from Smiths Falls airport, showing how long it would take to get to various places, assuming no wind. My normal cruise speed is 160, but you don’t get that far in the first hour, as the airspeed is slower as you climb to altitude, and it takes a few minutes at the other end to do the traffic pattern and land. I assumed 140 nm for the first hour. The next two hours are 160 nm further for each hour, as the whole additional hour is spent at normal cruise speed. After three hours, I assume I would land for a pit stop, so the fourth hour is back to 140 nm, etc. I could fly four hour legs, but I wouldn’t enjoy the last hour at all, if you know what I mean.
The GPS Visualizer will create an interactive page, which can be zoomed and panned, background maps can be changed, etc., but there was no way to embed the interactive page directly in this site. You’ll find the interactive range ring page at: